Transcription co-factor (TcoF) plays crucial roles in gene expression through communicating regulatory cues from enhancers to promoters. ChIP-seq techniques have become the most important strategy for identifying target genes of TcoFs and exploring functions of TcoFs. More importantly, integrated annotation and enrichment analysis will be very useful for elucidating the mechanism of TcoFs on transcriptional regulation.
Here, we developed the TcoFBase database (http://tcof.liclab.net/TcoFbase/index.html), which aims to document a large number of available resources of mammals TcoFs, provided annotation and enrichment analyses of TcoFs.
The current version of TcoFBase cataloged a total of 2,322 TcoFs and 5,673 TcoFs associated ChIP-seq data from over 380 tissues/cell types in human and mouse. TcoFBase provides a conveniently user-friendly interface to query, browse, analyze and download TcoFs and their related annotation information.
TcoFBase not only provides TcoF and ChIP-seq TcoF-binding site datasets, but also provides eight annotation sections were provided including TcoF overview, TcoF-associated genes network, ChIP-seq based regulatory details of TcoF, Downstream target genes, upstream regulatory details, annotation, survival, expression and disease information. The genetic and epigenomic data involved Super enhancer, Enhancer, TFBS, methylation sites, common SNPs, risk SNPs, eQTLs, histone modifications and 3D chromatin interactions. In addition, to perform the in-depth analysis of TcoF, TcoFBase provide fie analysis: (I) TcoF gene set enrichment, (II) TcoF binding genomic region annotation, (III) TcoF regulatory network analysis, (Ⅳ) TcoF-TF co-occupancy analysis, (Ⅴ) TcoF regulatory axis analysis.
URL: http://tcof.liclab.net/TcoFbase/search.php
4.1 Browse
The "Browse" page is an interactive table with alphanumeric sorting function that allows users to quickly search TcoFs and customize filters through " Species"," Family" and "TcoF Class " in the left panel. To view the TcoF, users can click the "TcoF" in the right table.
4.2 Search
TcoFBase provides four query methods for searching TcoF information. These include ‘Search by TcoF’ (select species and input TcoF of interest), ‘Search by genomic region’ (select species and input genomic regions), ‘Search by target gene’ (select species and input a gene of interest) and ‘Search by TcoF family’ (select species and input a TcoF family name).
Search result of TcoF for EP300

Users can click 'TcoF_00_3061405753'and the detail information about the region will be displayed on the next page.
4.3 Analysis
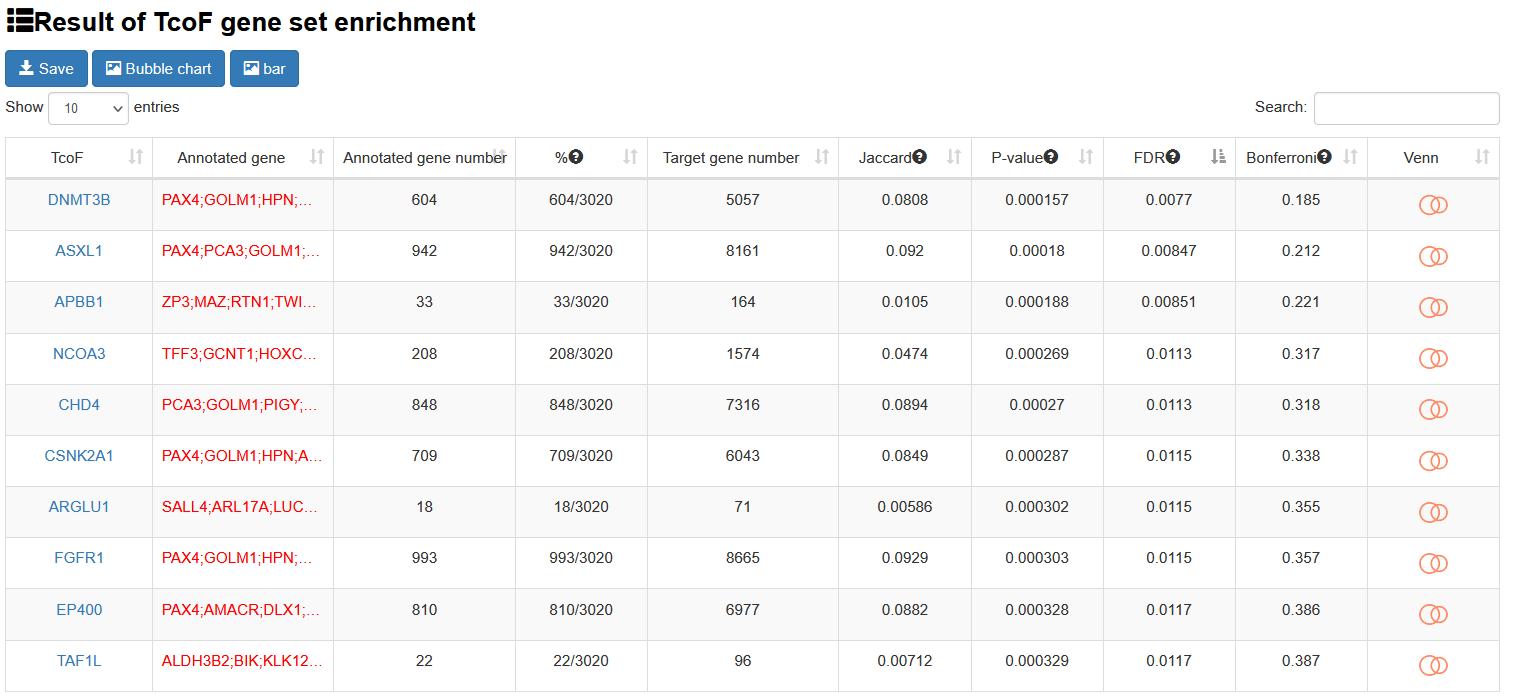
4.3.1 TcoF gene set enrichment
URL: http://tcof.liclab.net/TcoFbase/Analysis/Analysis.php
To ensure the high dependability TcoF-target network, we only reserved the TcoF-target pairs that were supported by more than half of the methods, so we used the threshold of more than three methods for human and more than two methods in mouse. With the input of gene(s) of interest or a ‘txt’ format file. Users can submit a gene list, choose the species (human or mouse) and set p-value/FDR to perform TcoF gene set enrichment.
TcoFBase will execute hypergeometric test between the submitted gene set and target gene set of each TcoF.
The guidance for input format:only gene symbol is supported (case-insensitive). Example of Upload File
The output table shows all significant collection information related input (TcoF, Annotated gene, Target gene number, Annotated gene number), enrichment score P-value, FDR, Jarcard and Bonferroni. The TcoF can be visualized by clicking the "TcoF" button.

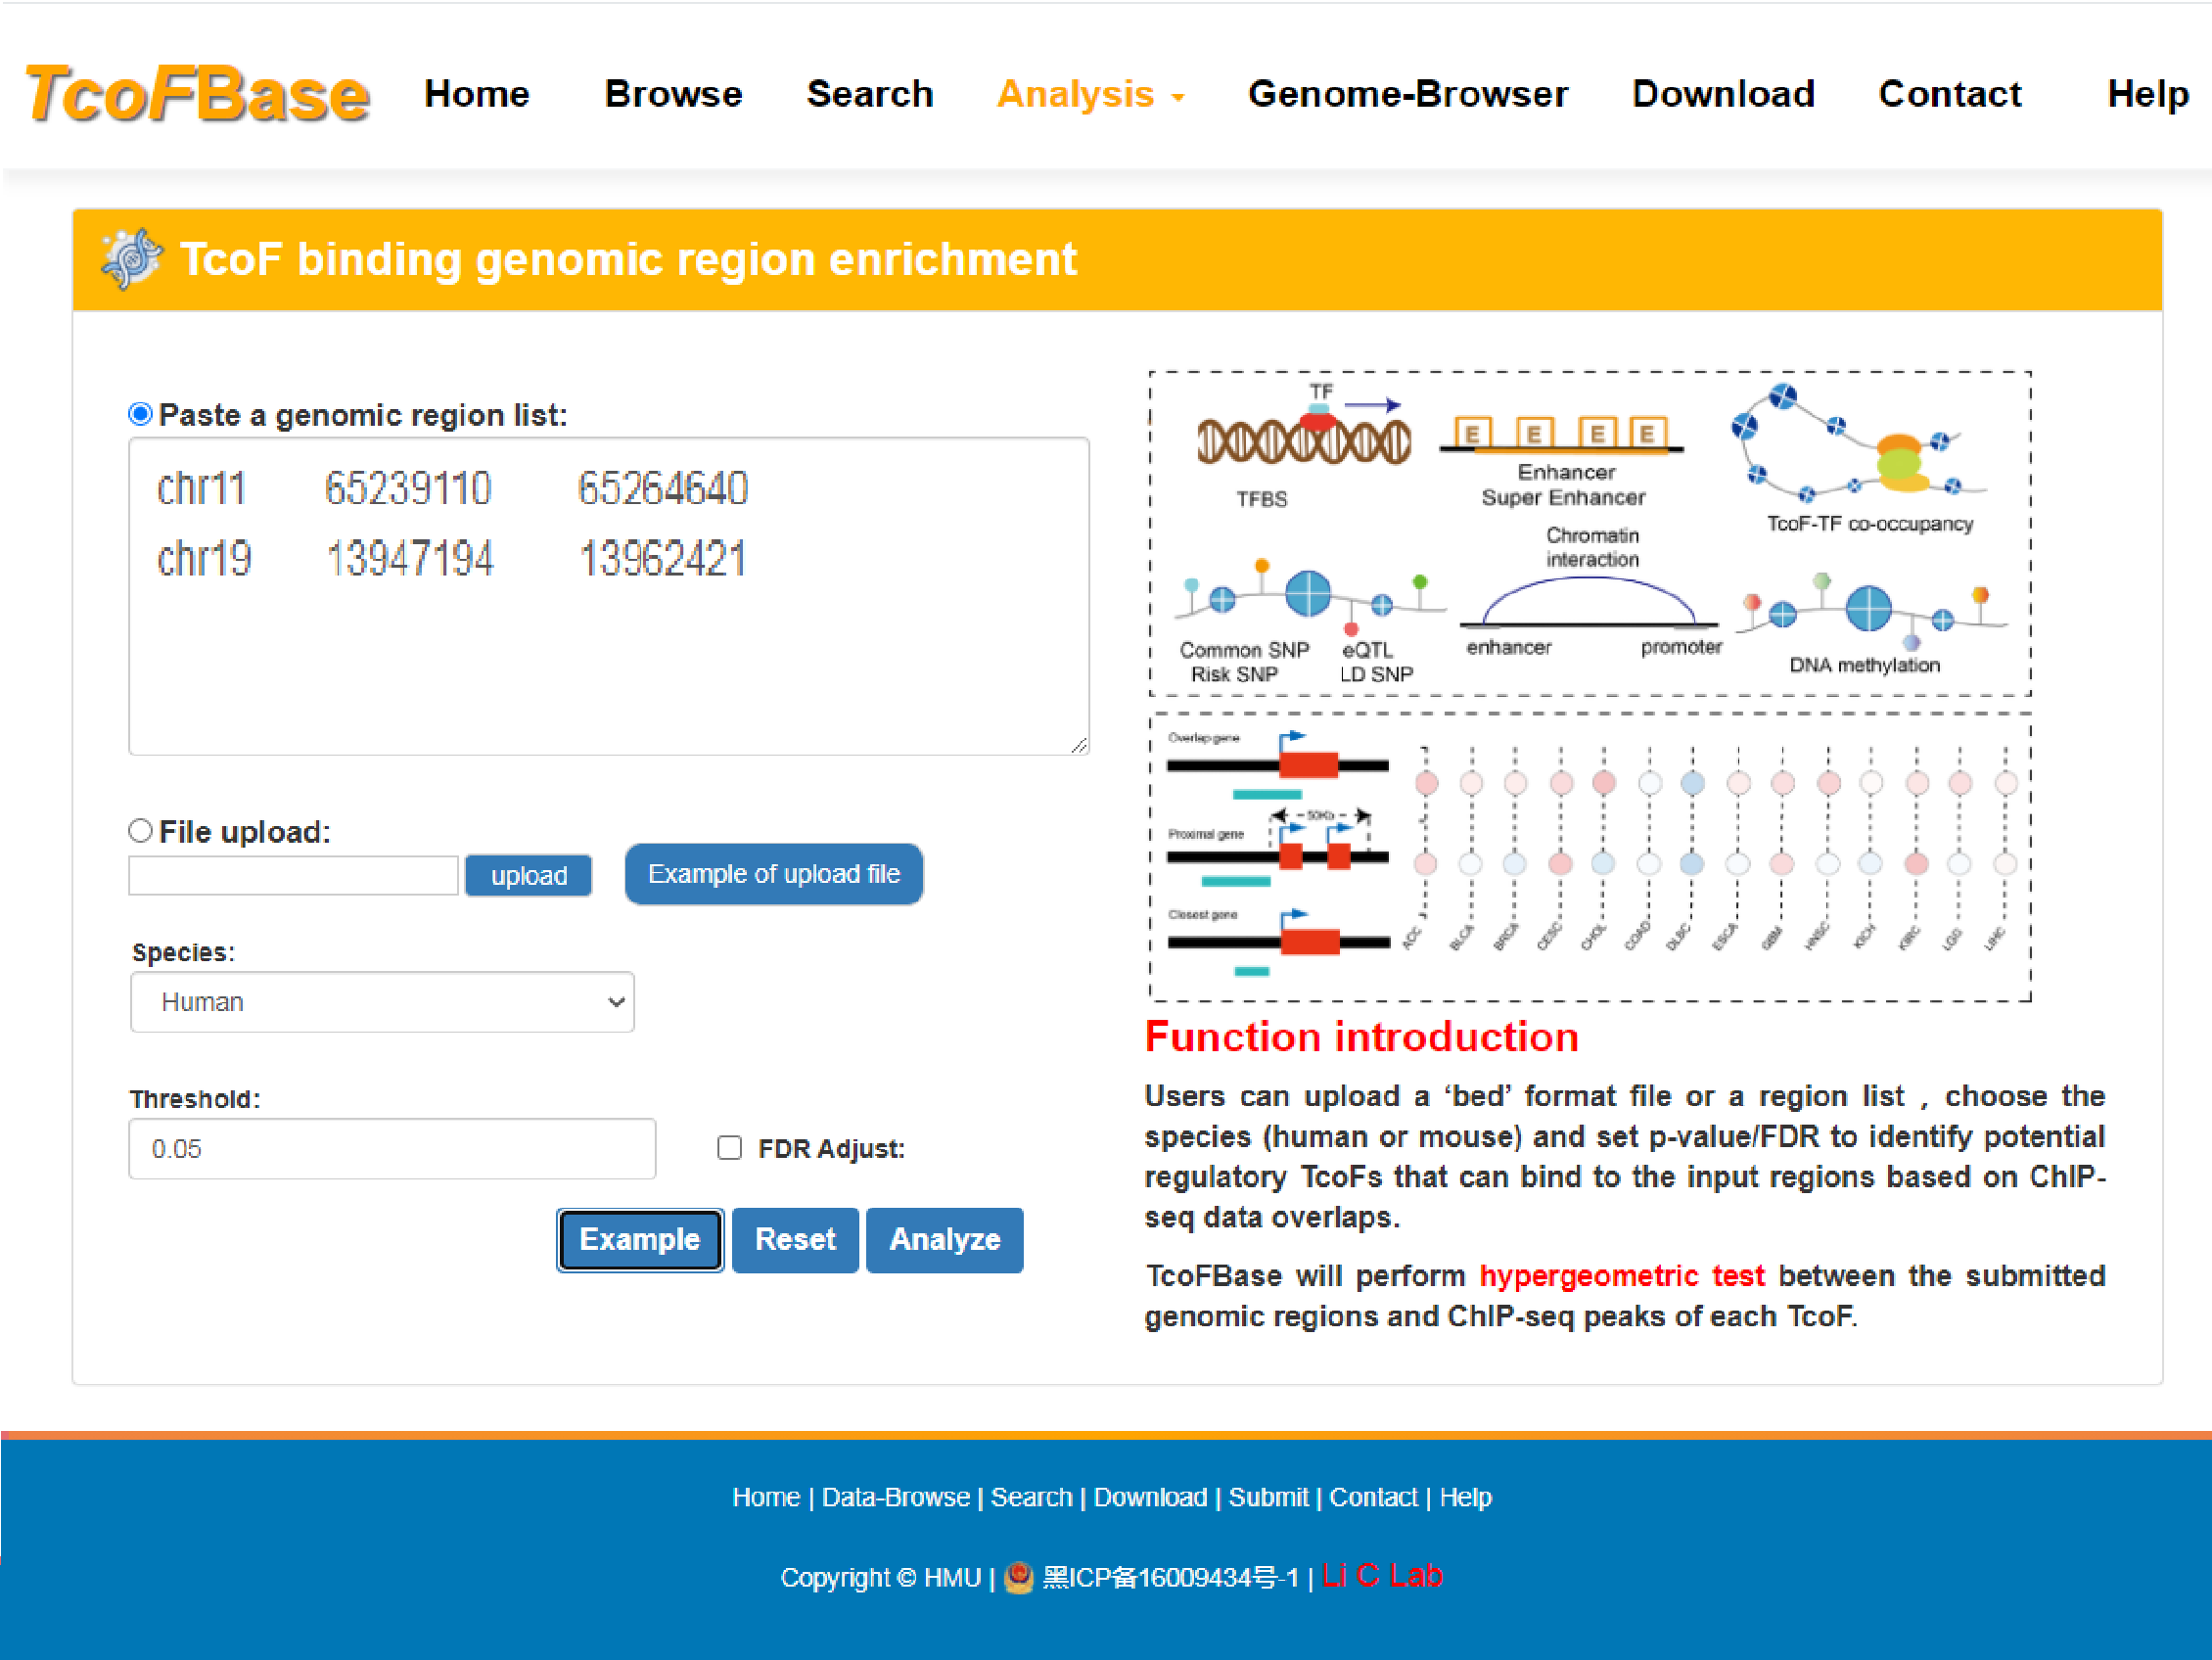
4.3.2 TcoF binding genomic region annotation
URL: http://tcof.liclab.net/TcoFbase/Analysis/Analysis_peak.html
In this analysis, by uploading a ‘bed’ format file or a region list, TcoFBase will perform hypergeometric test on the submitted genomic regions and all ChIP-seq peaks of each TcoF.
Users can upload a ‘bed’ format file or a region list, choose the species (human or mouse) and set p-value/FDR to identify potential regulatory TcoFs that can bind to the input regions based on ChIP-seq data overlaps. The guidance for input format is as below:
Region definitions are ordinary 3-field bed file format.
#column 1: The name of the chromosome (e.g. chr3, chrY).
#column 2: The starting position in the chromosome.
#column 3: The ending position in the chromosome.
For example: Example of Upload File
chr11 65239110 65264640
chr19 13947194 13962421
chr1 30649567 30655759
chr1 11345200 1135961
Brief information on the search results is displayed in a table on the result page, The TcoF can be visualized by clicking the "TcoF" button.
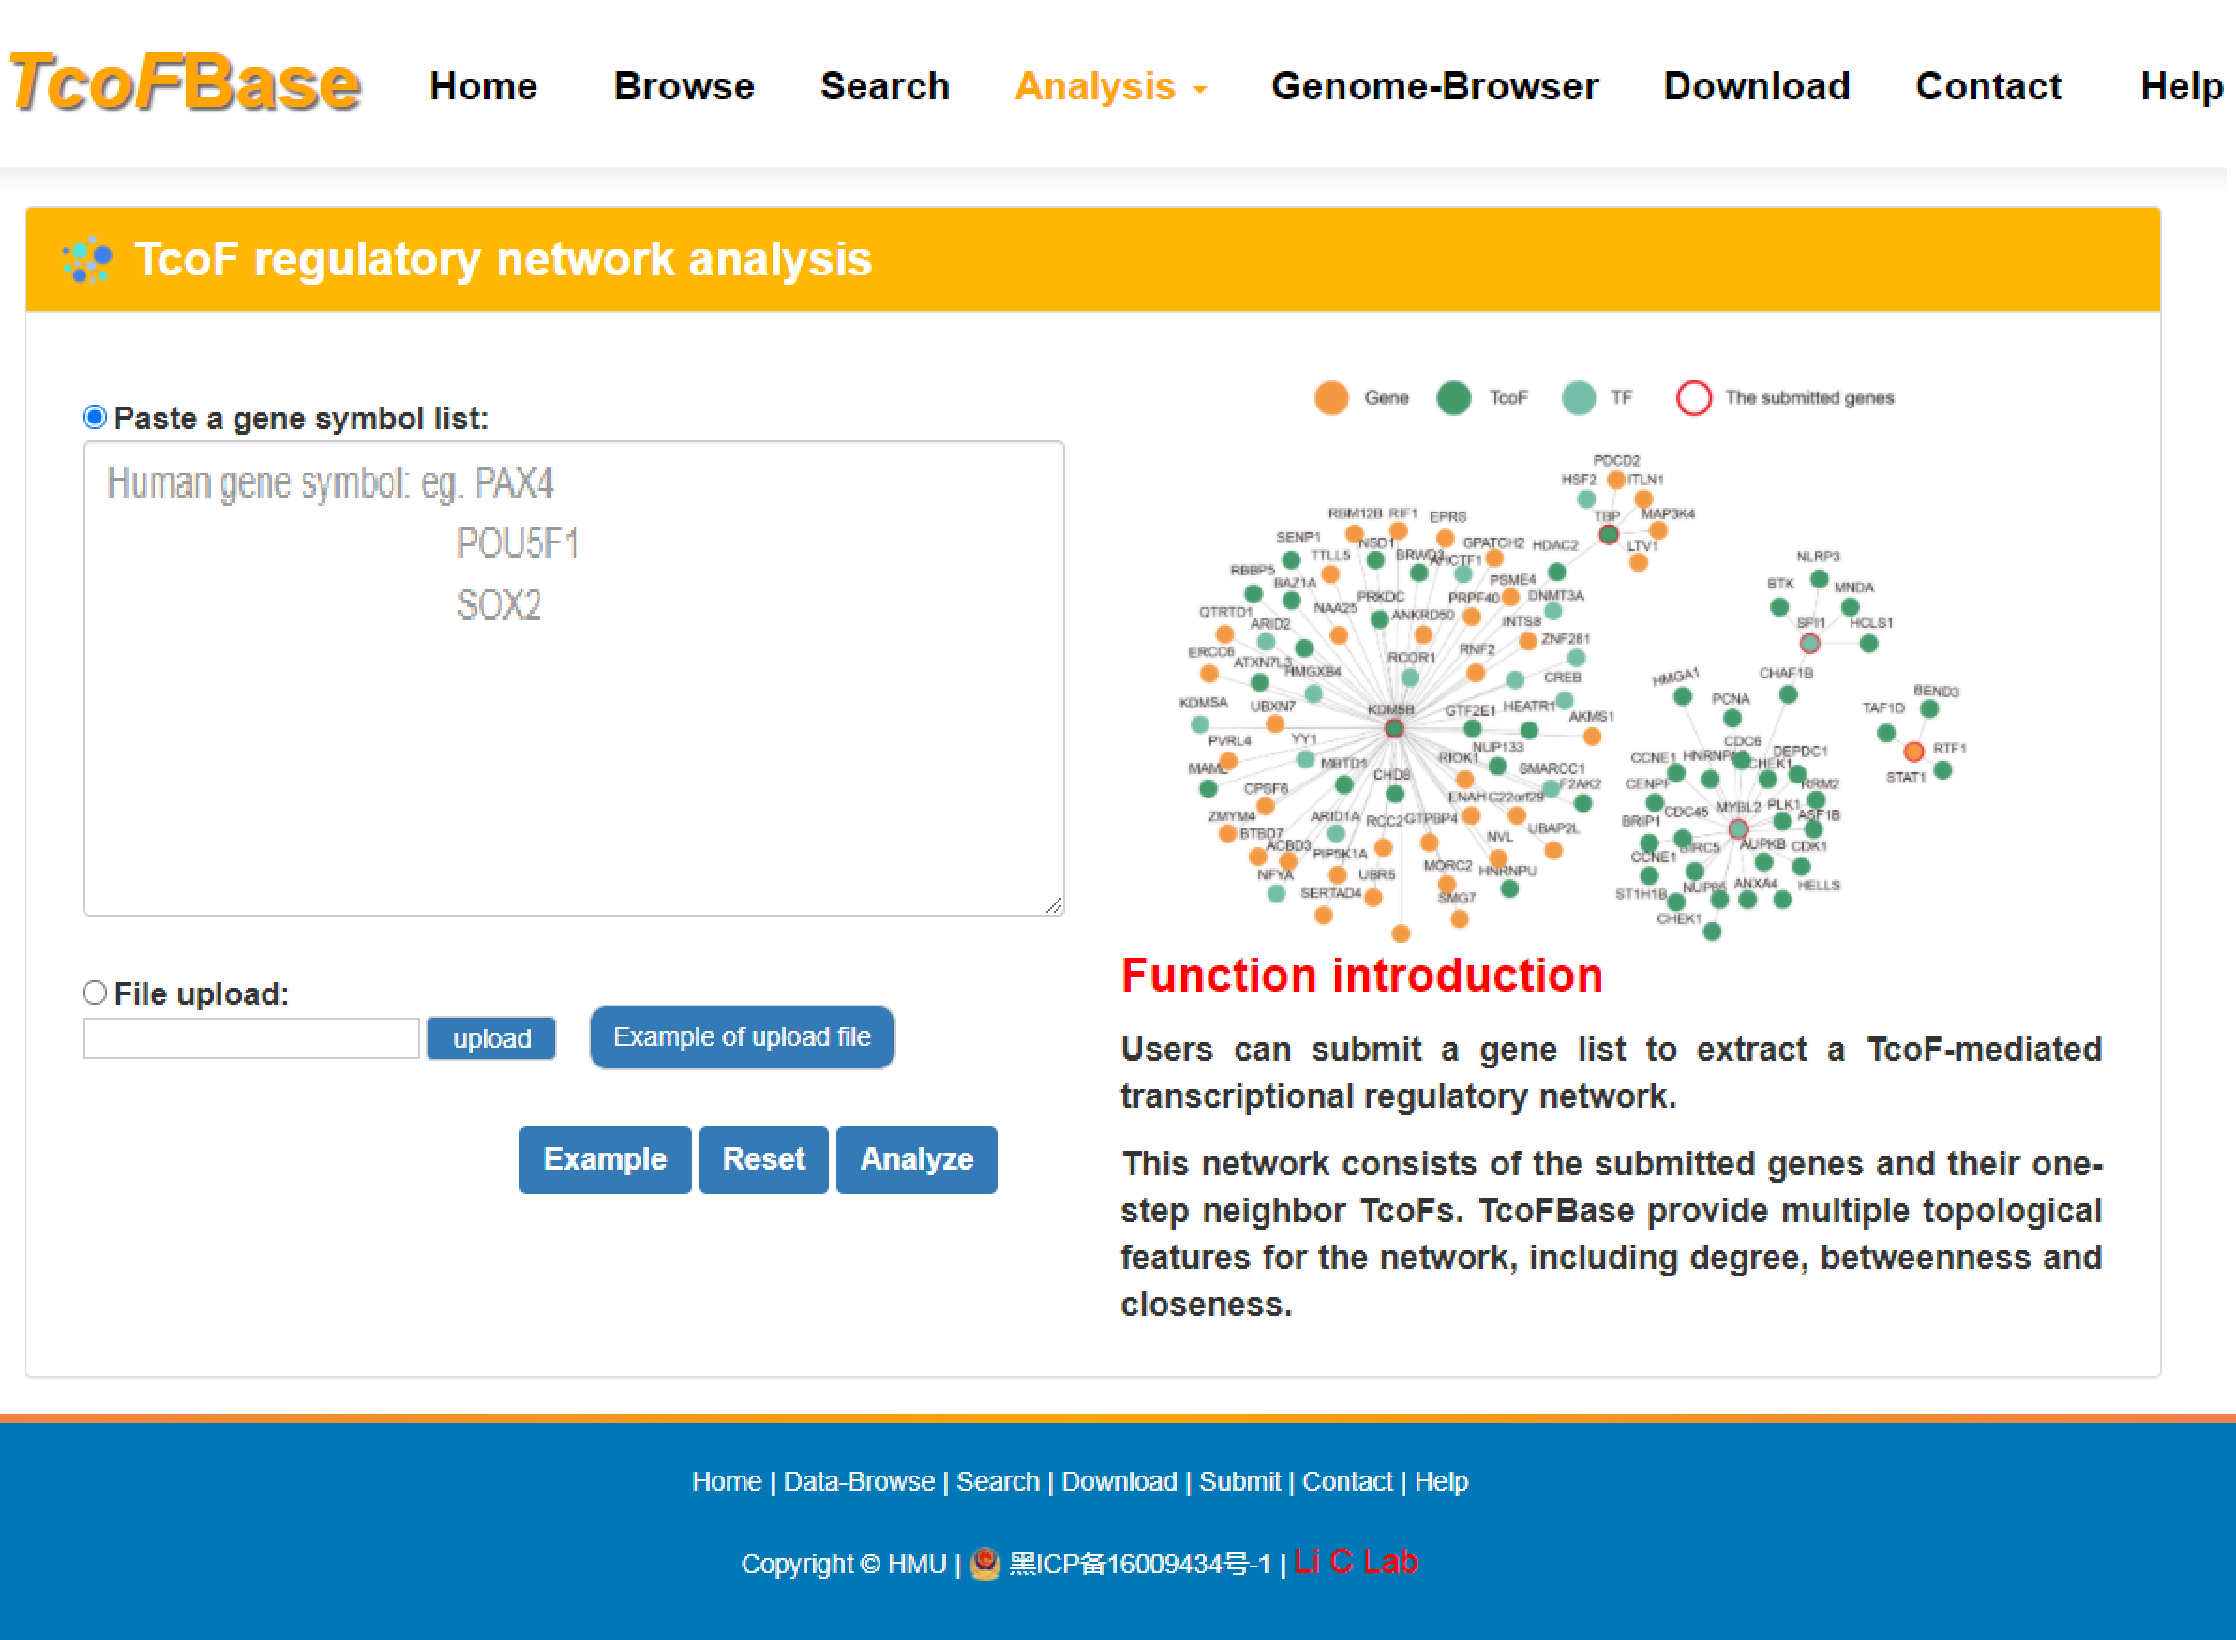
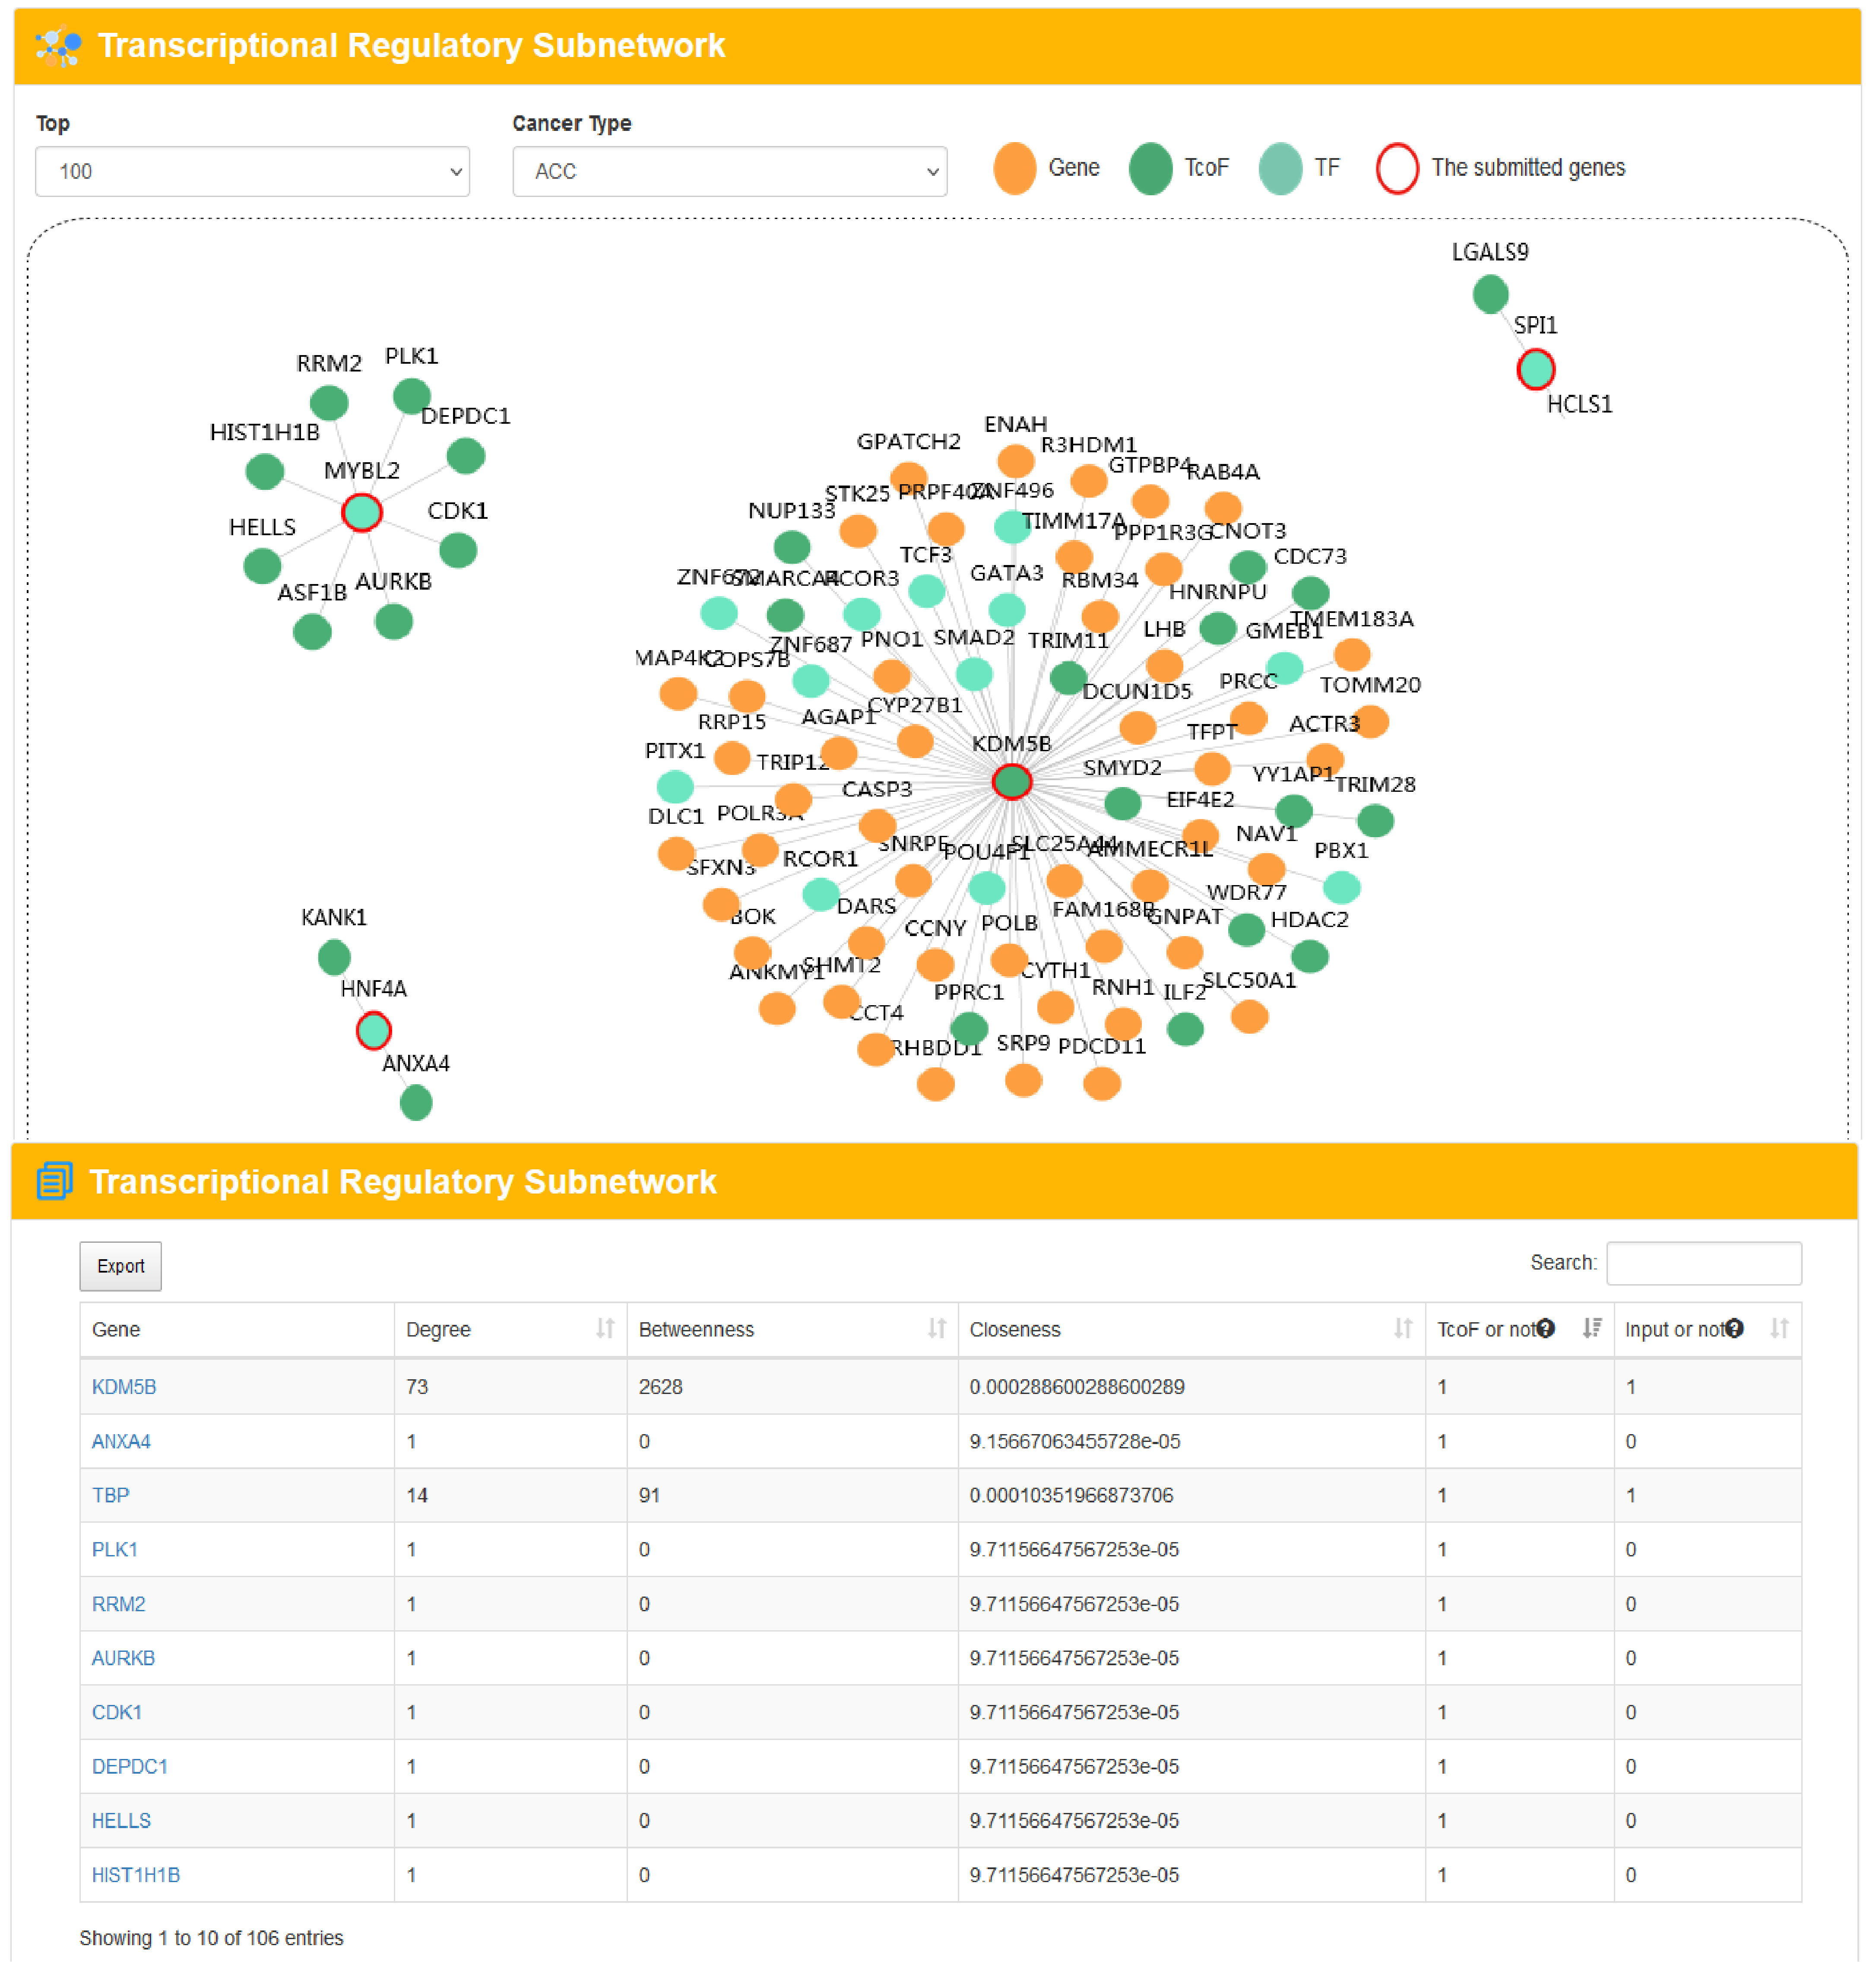
4.3.3 TcoF regulatory network analysis
URL: http://tcof.liclab.net/TcoFbase/Analysis/Analysis_gene.html
There is no limit on the genes number of TcoF regulatory network, but we recommend that the number of input genes should preferably be less than 1,000 to ensure the speed of analysis. With the input of a human gene list to extract a TcoF-mediated transcriptional regulatory network.sers can choose network size displays by filtering the number of the most important TcoF- associated gene pairs in different cancer types. TcoFBase also provides topological features of network genes including degree, betweenness and closeness. The TcoF can be visualized by clicking the "TcoF" button.
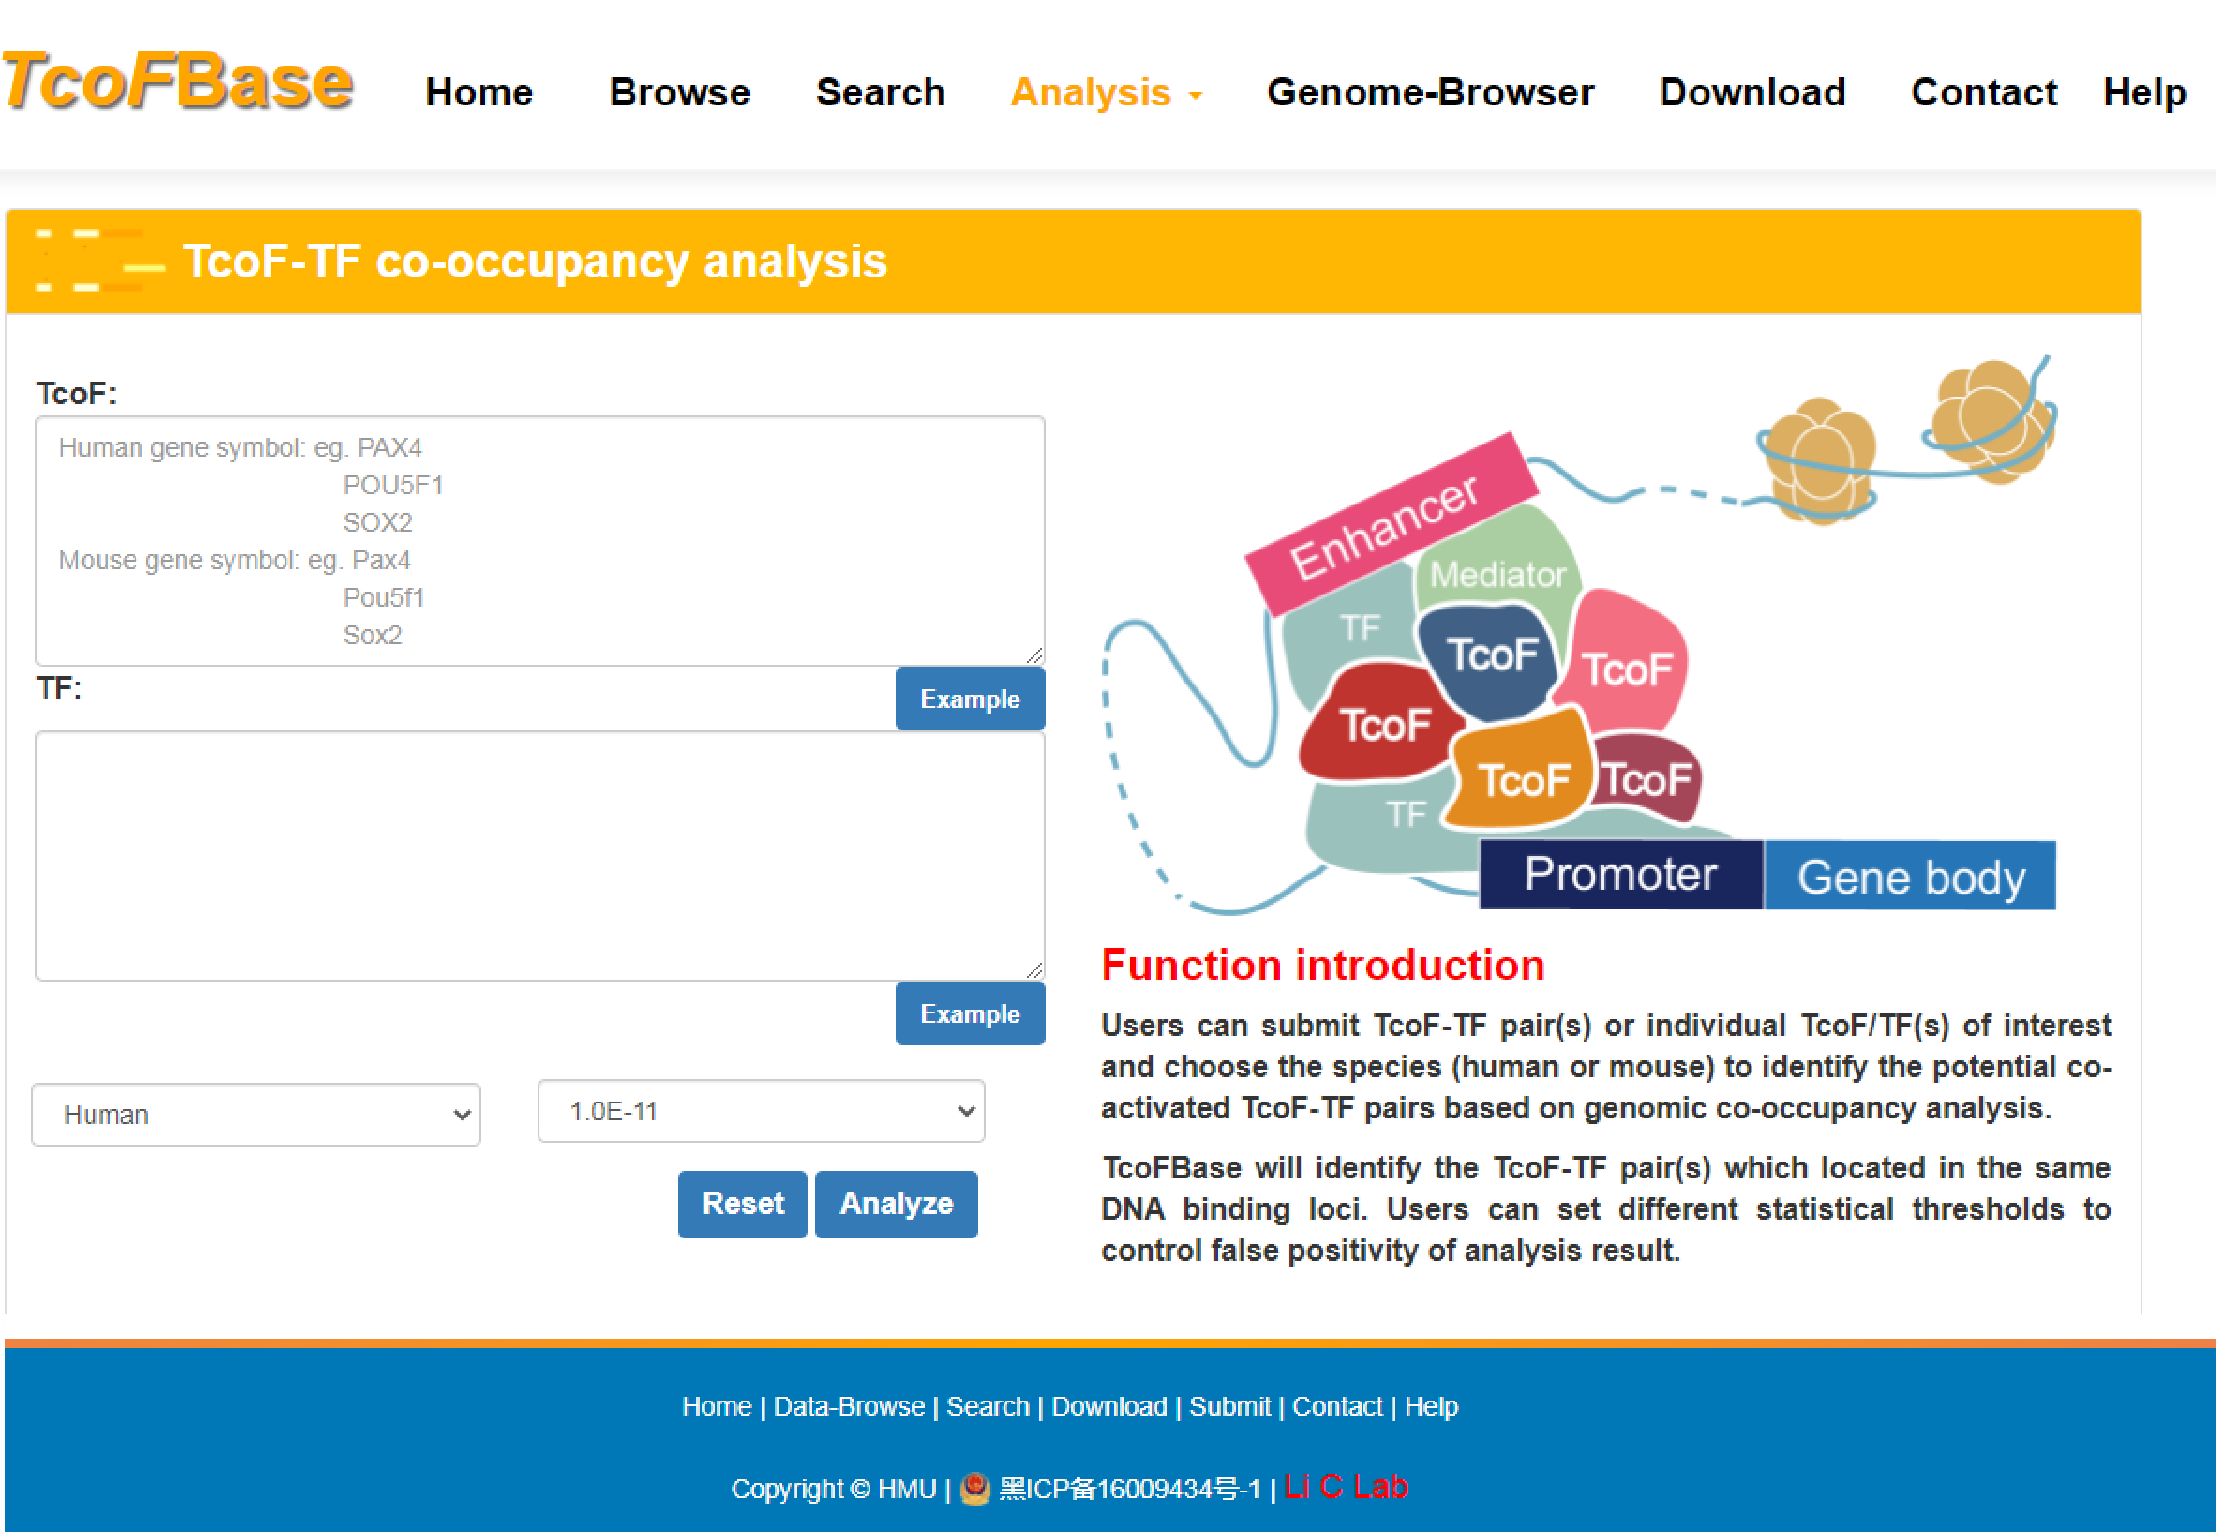
4.3.4 TcoF-TF co-occupancy analysis
URL: http://tcof.liclab.net/TcoFbase/Analysis/analysis_motif.php
User can submit a TcoF-TF pair or individual TcoF/TF(s) of interest and choose the species (human or mouse) to identify the potential co-activated TcoF-TF pairs based on genomic co-occupancy analysis. TcoFBase offers ‘FIMO’ option to allow users to set different thresholds to control false positivity.
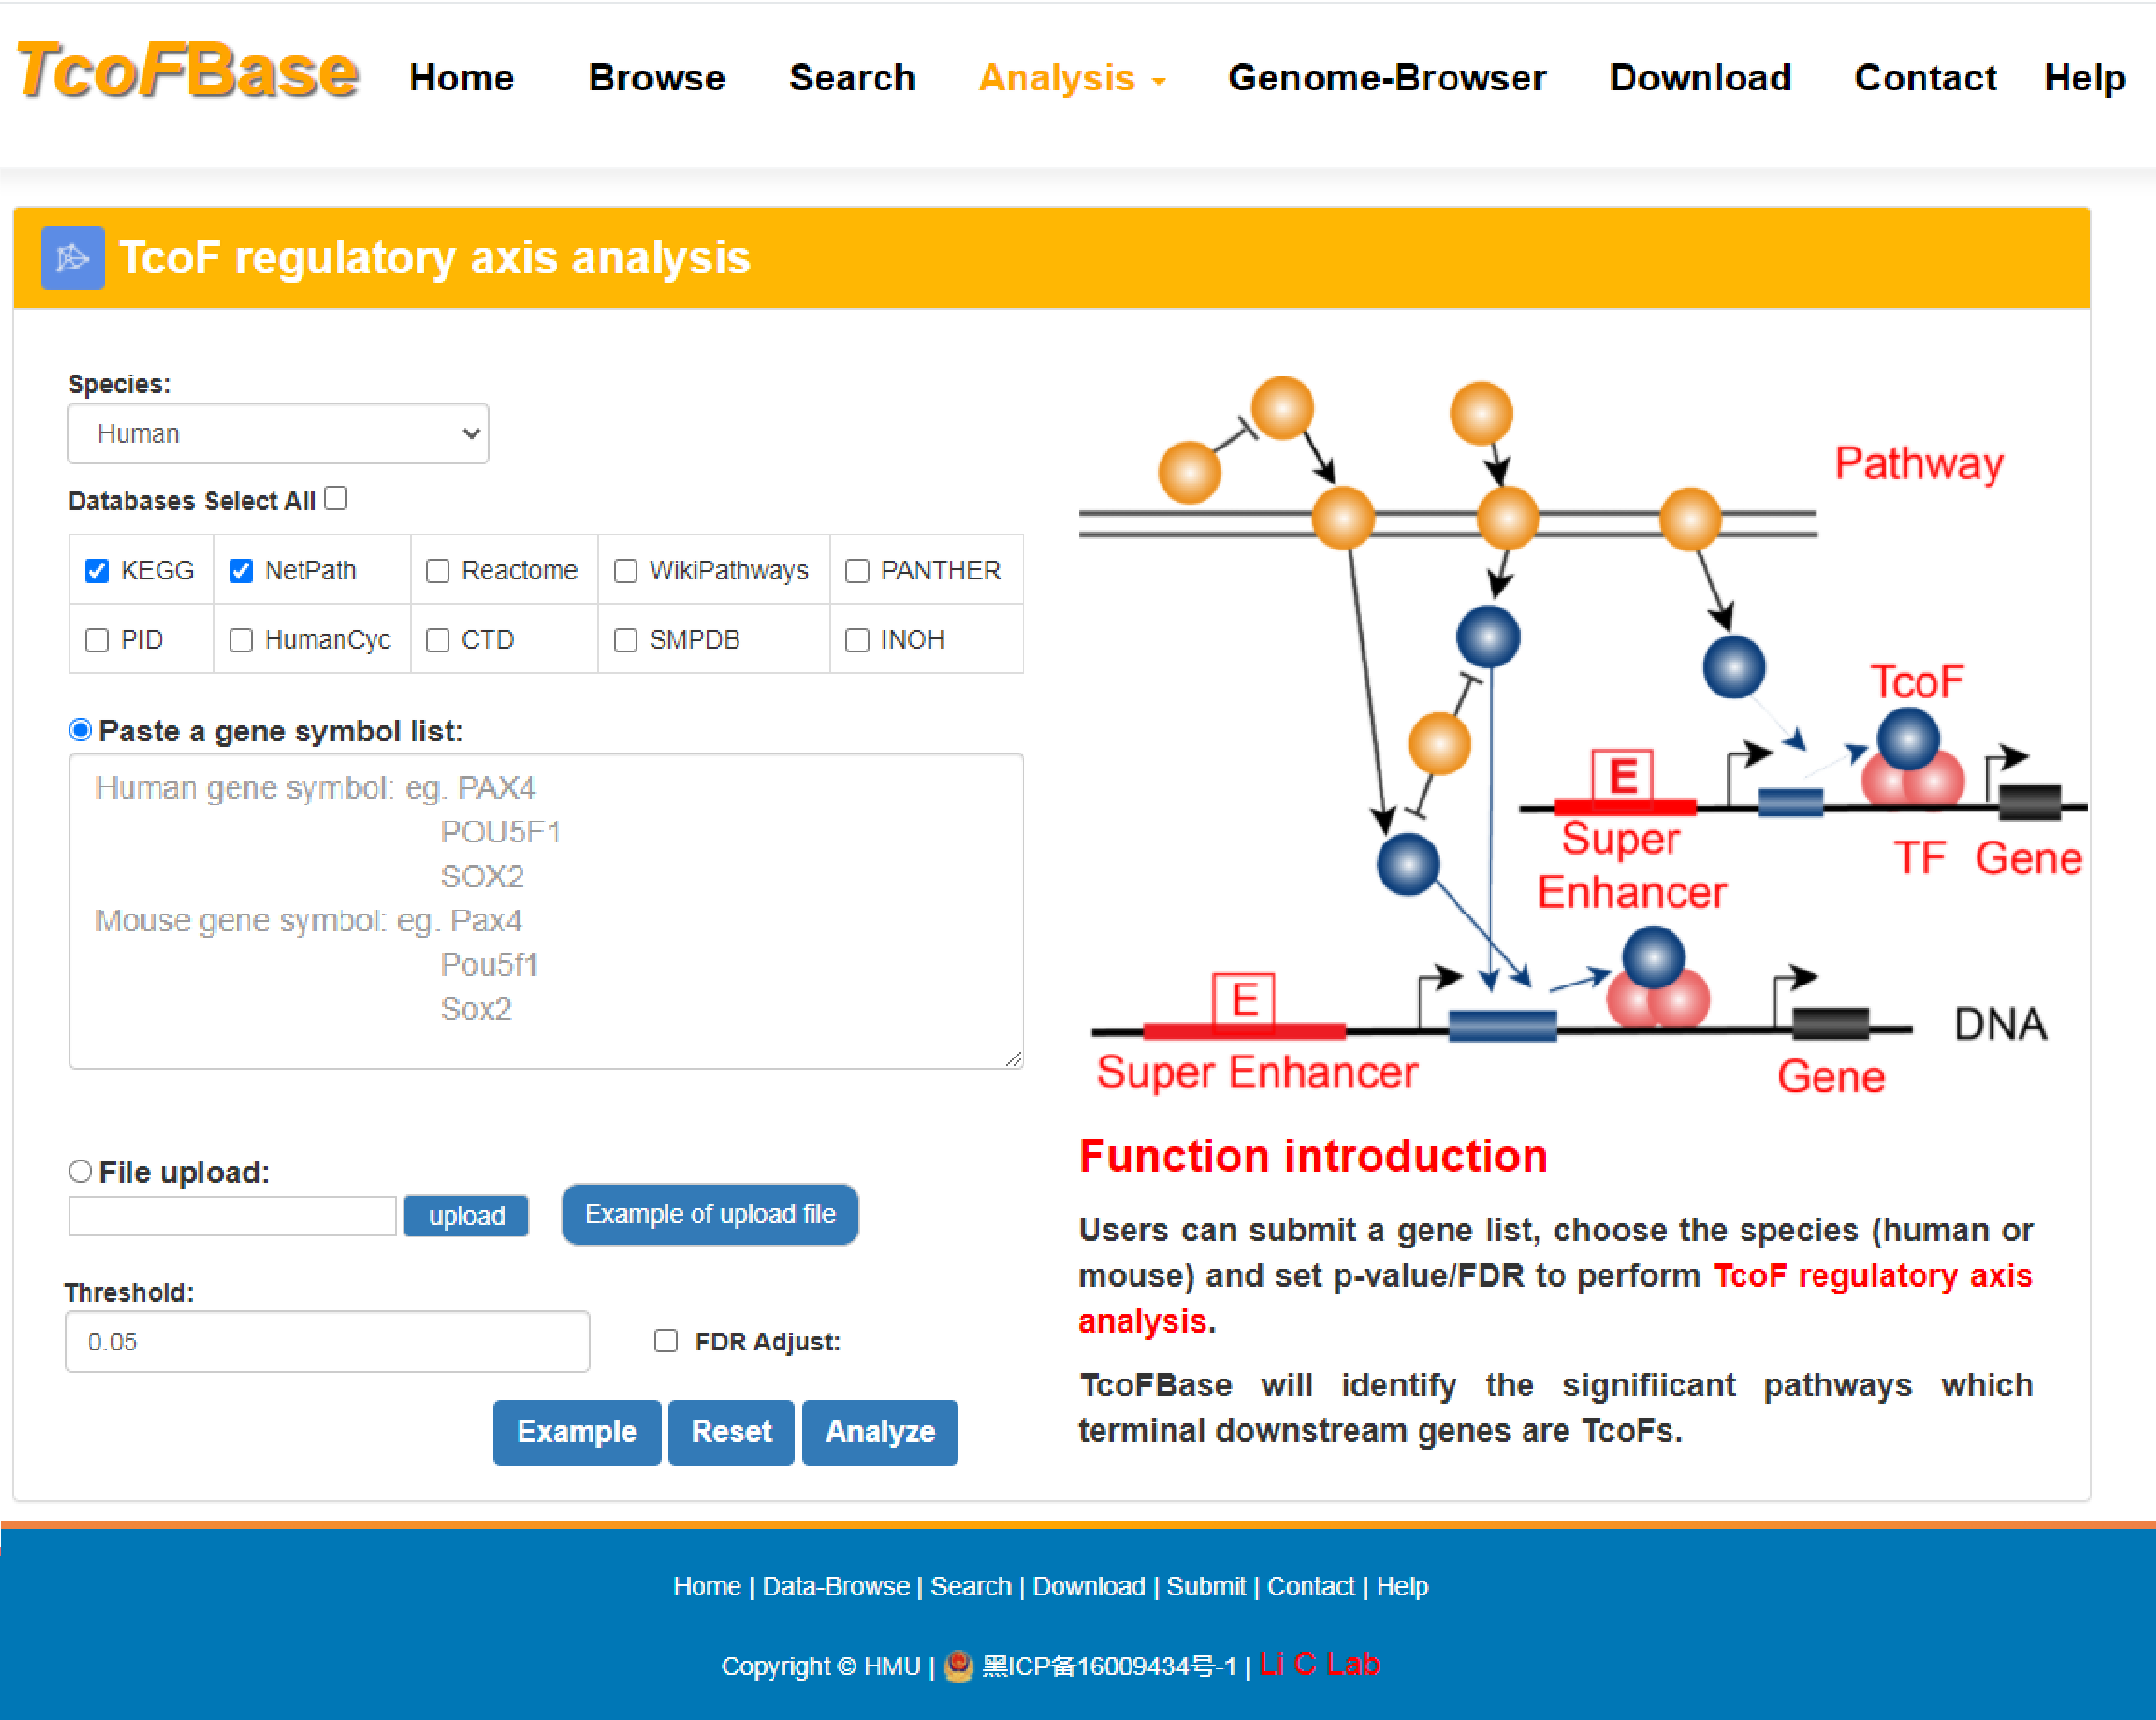
4.3.5 TcoF regulatory axis analysis
URL: http://tcof.liclab.net/TcoFbase/Analysis/Analysis_pathway.php
With the input of gene(s) of interest or a‘txt’ format file, TcoFBase will identify significantly enriched pathways whose terminal downstream genes are TcoFs.
The guidance for input format:only gene symbol is supported (case-insensitive).
Users can set p-value and FDR thresholds to filter the results ,and choose the species (human or mouse).
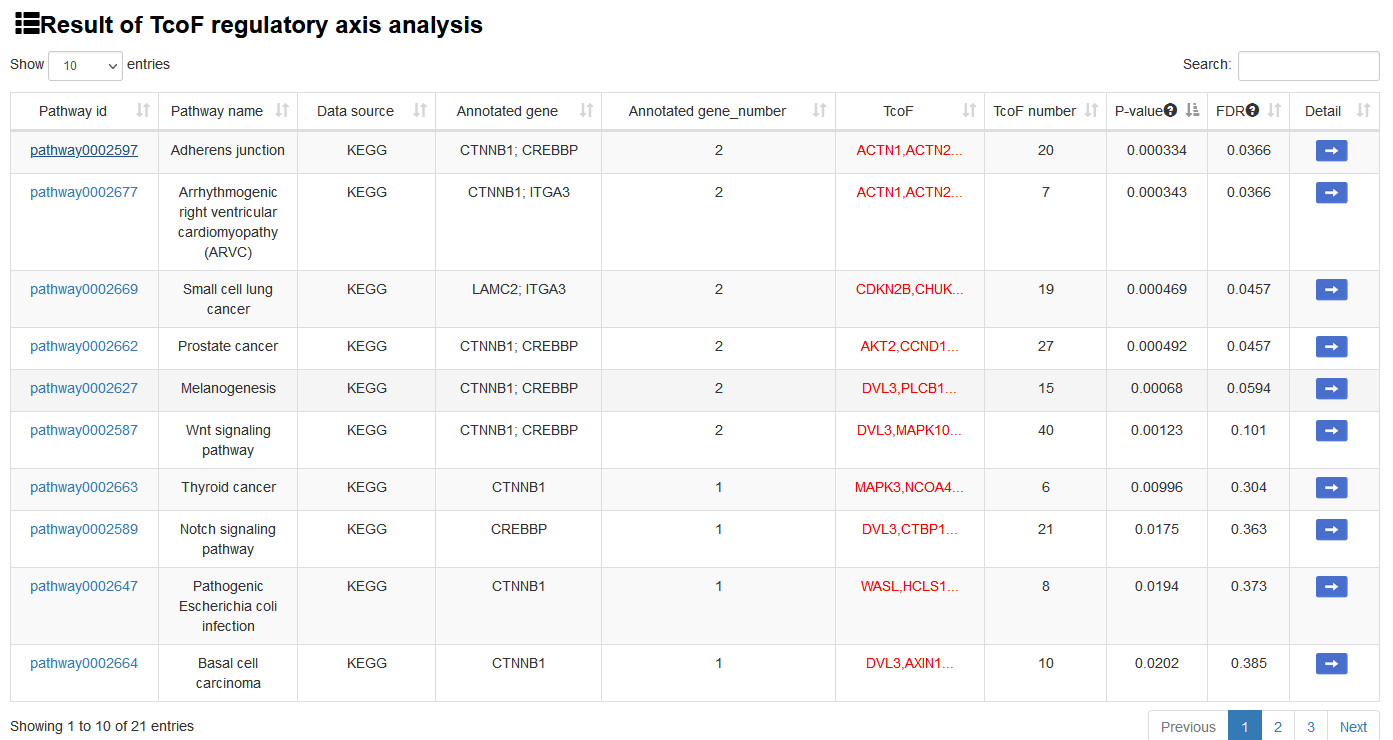
The output table shows pathway basic information (Pathway ID, Pathway name, Pathway source, Annotated gene, Annotated gene number, Total gene number, The terminal TcoF and TcoF number), enrichment score p-value and FDR. The pathways can be visualized by clicking the "pathway ID" button. The output table also provides a ‘Detail’ page to further show the information of TcoFs. The regulatory networks based on the TcoFs in this pathway can also be visualized. The TcoF can be visualized by clicking the "TcoF" button.
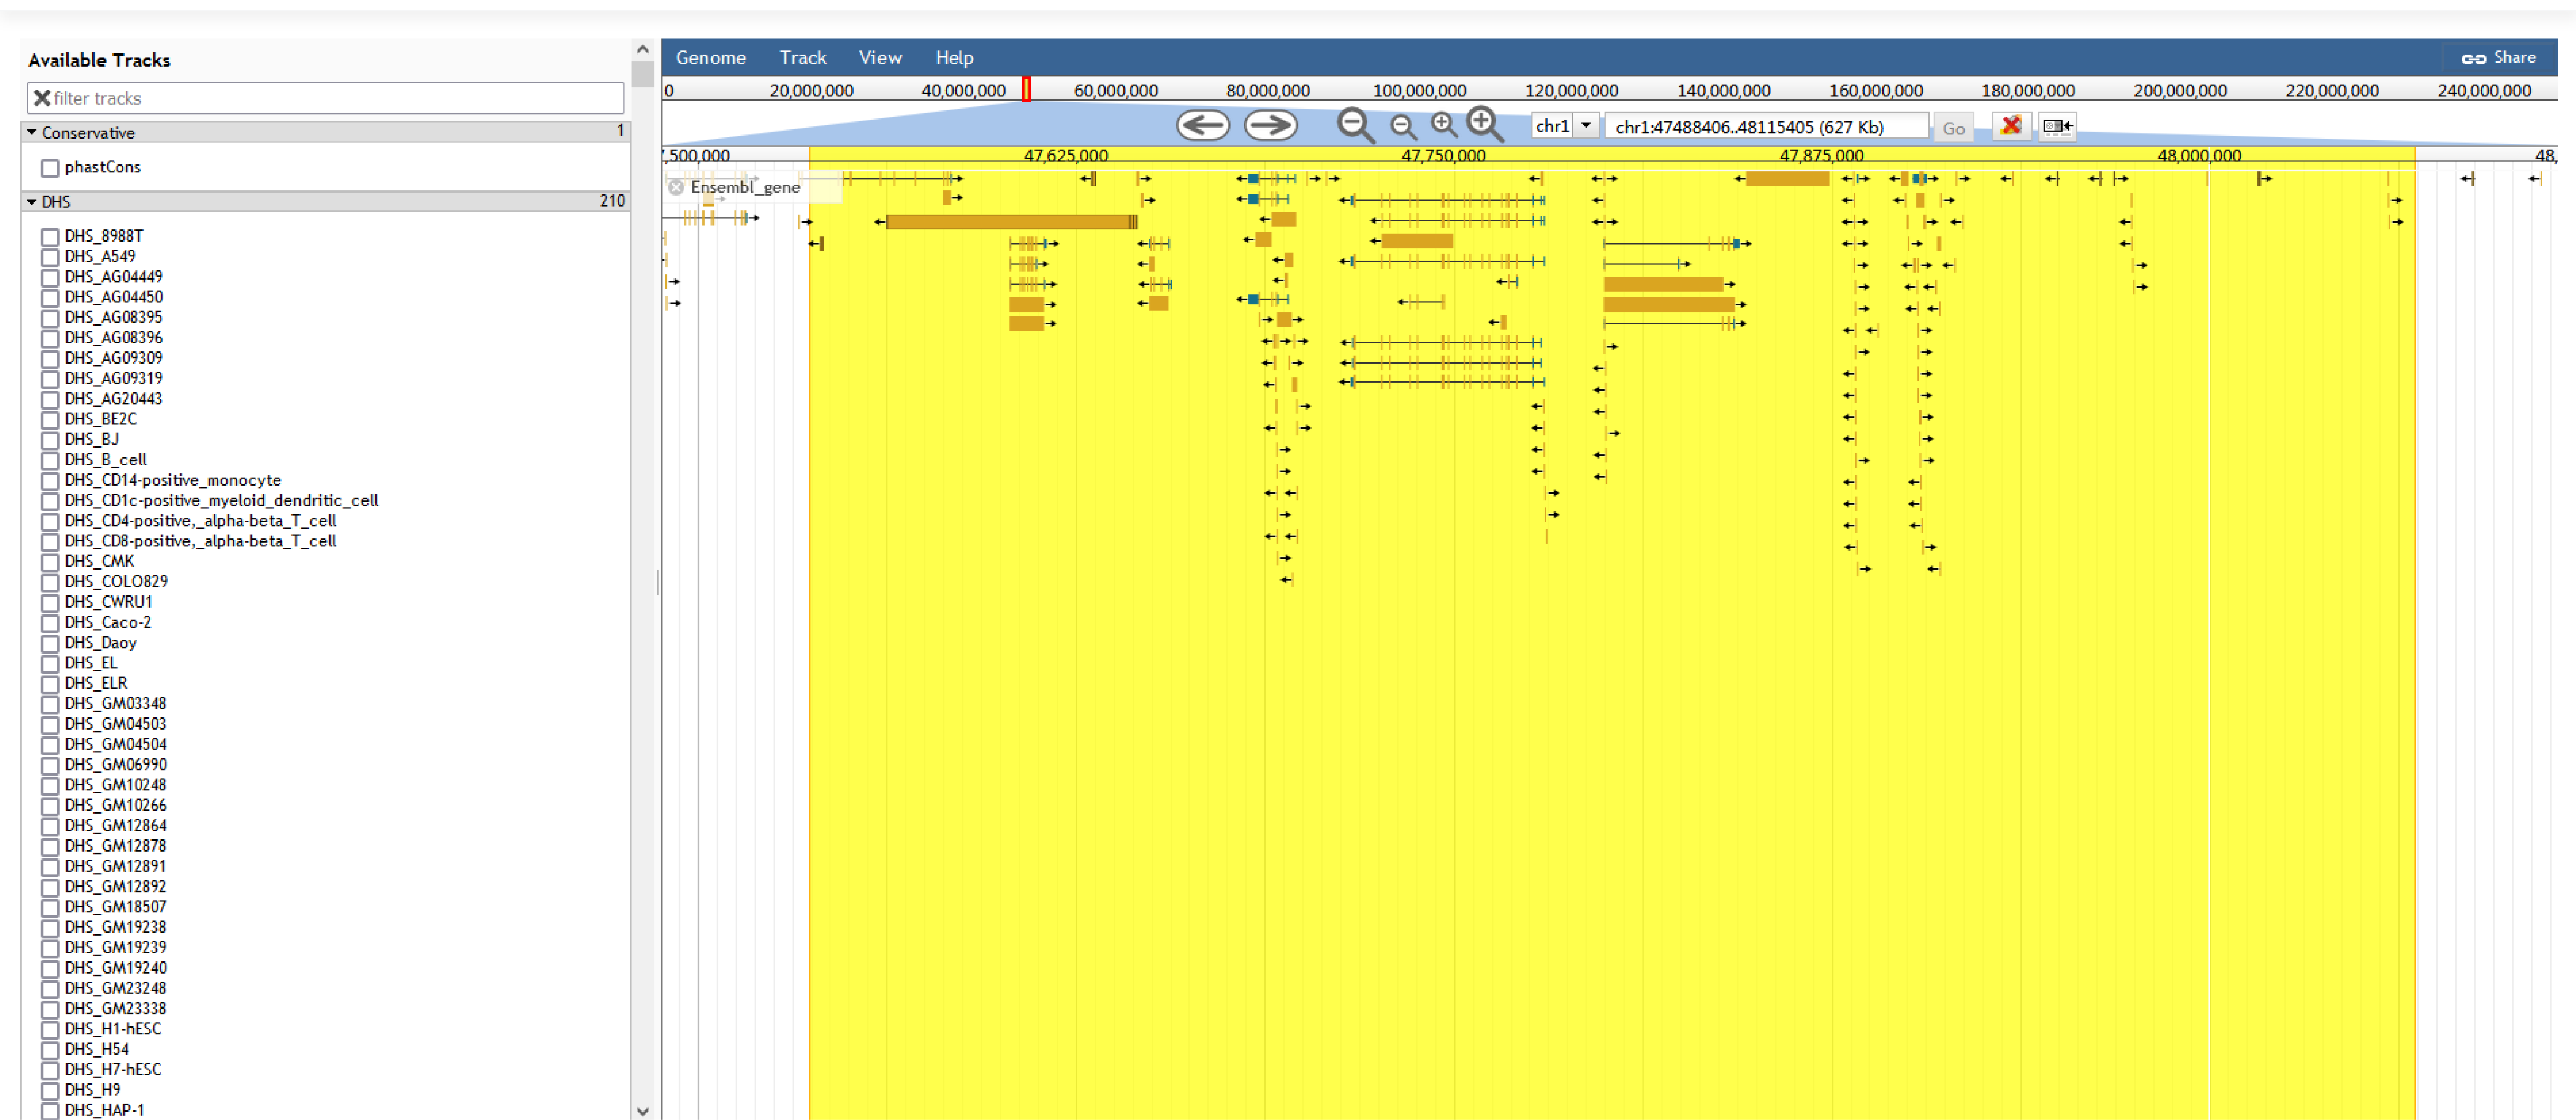
URL: http://tcof.liclab.net/TcoFbase/Genome_Browser.php
To help users view TcoFs along the human genome, we developed a customizable genome browser using JBrowse with more than 1,500 tracks. Users can view the genomic locations of TcoFs, Super enhancer, Enhancer, TFBS identified by ChIP-seq, SNP, DHS, and conservative score.
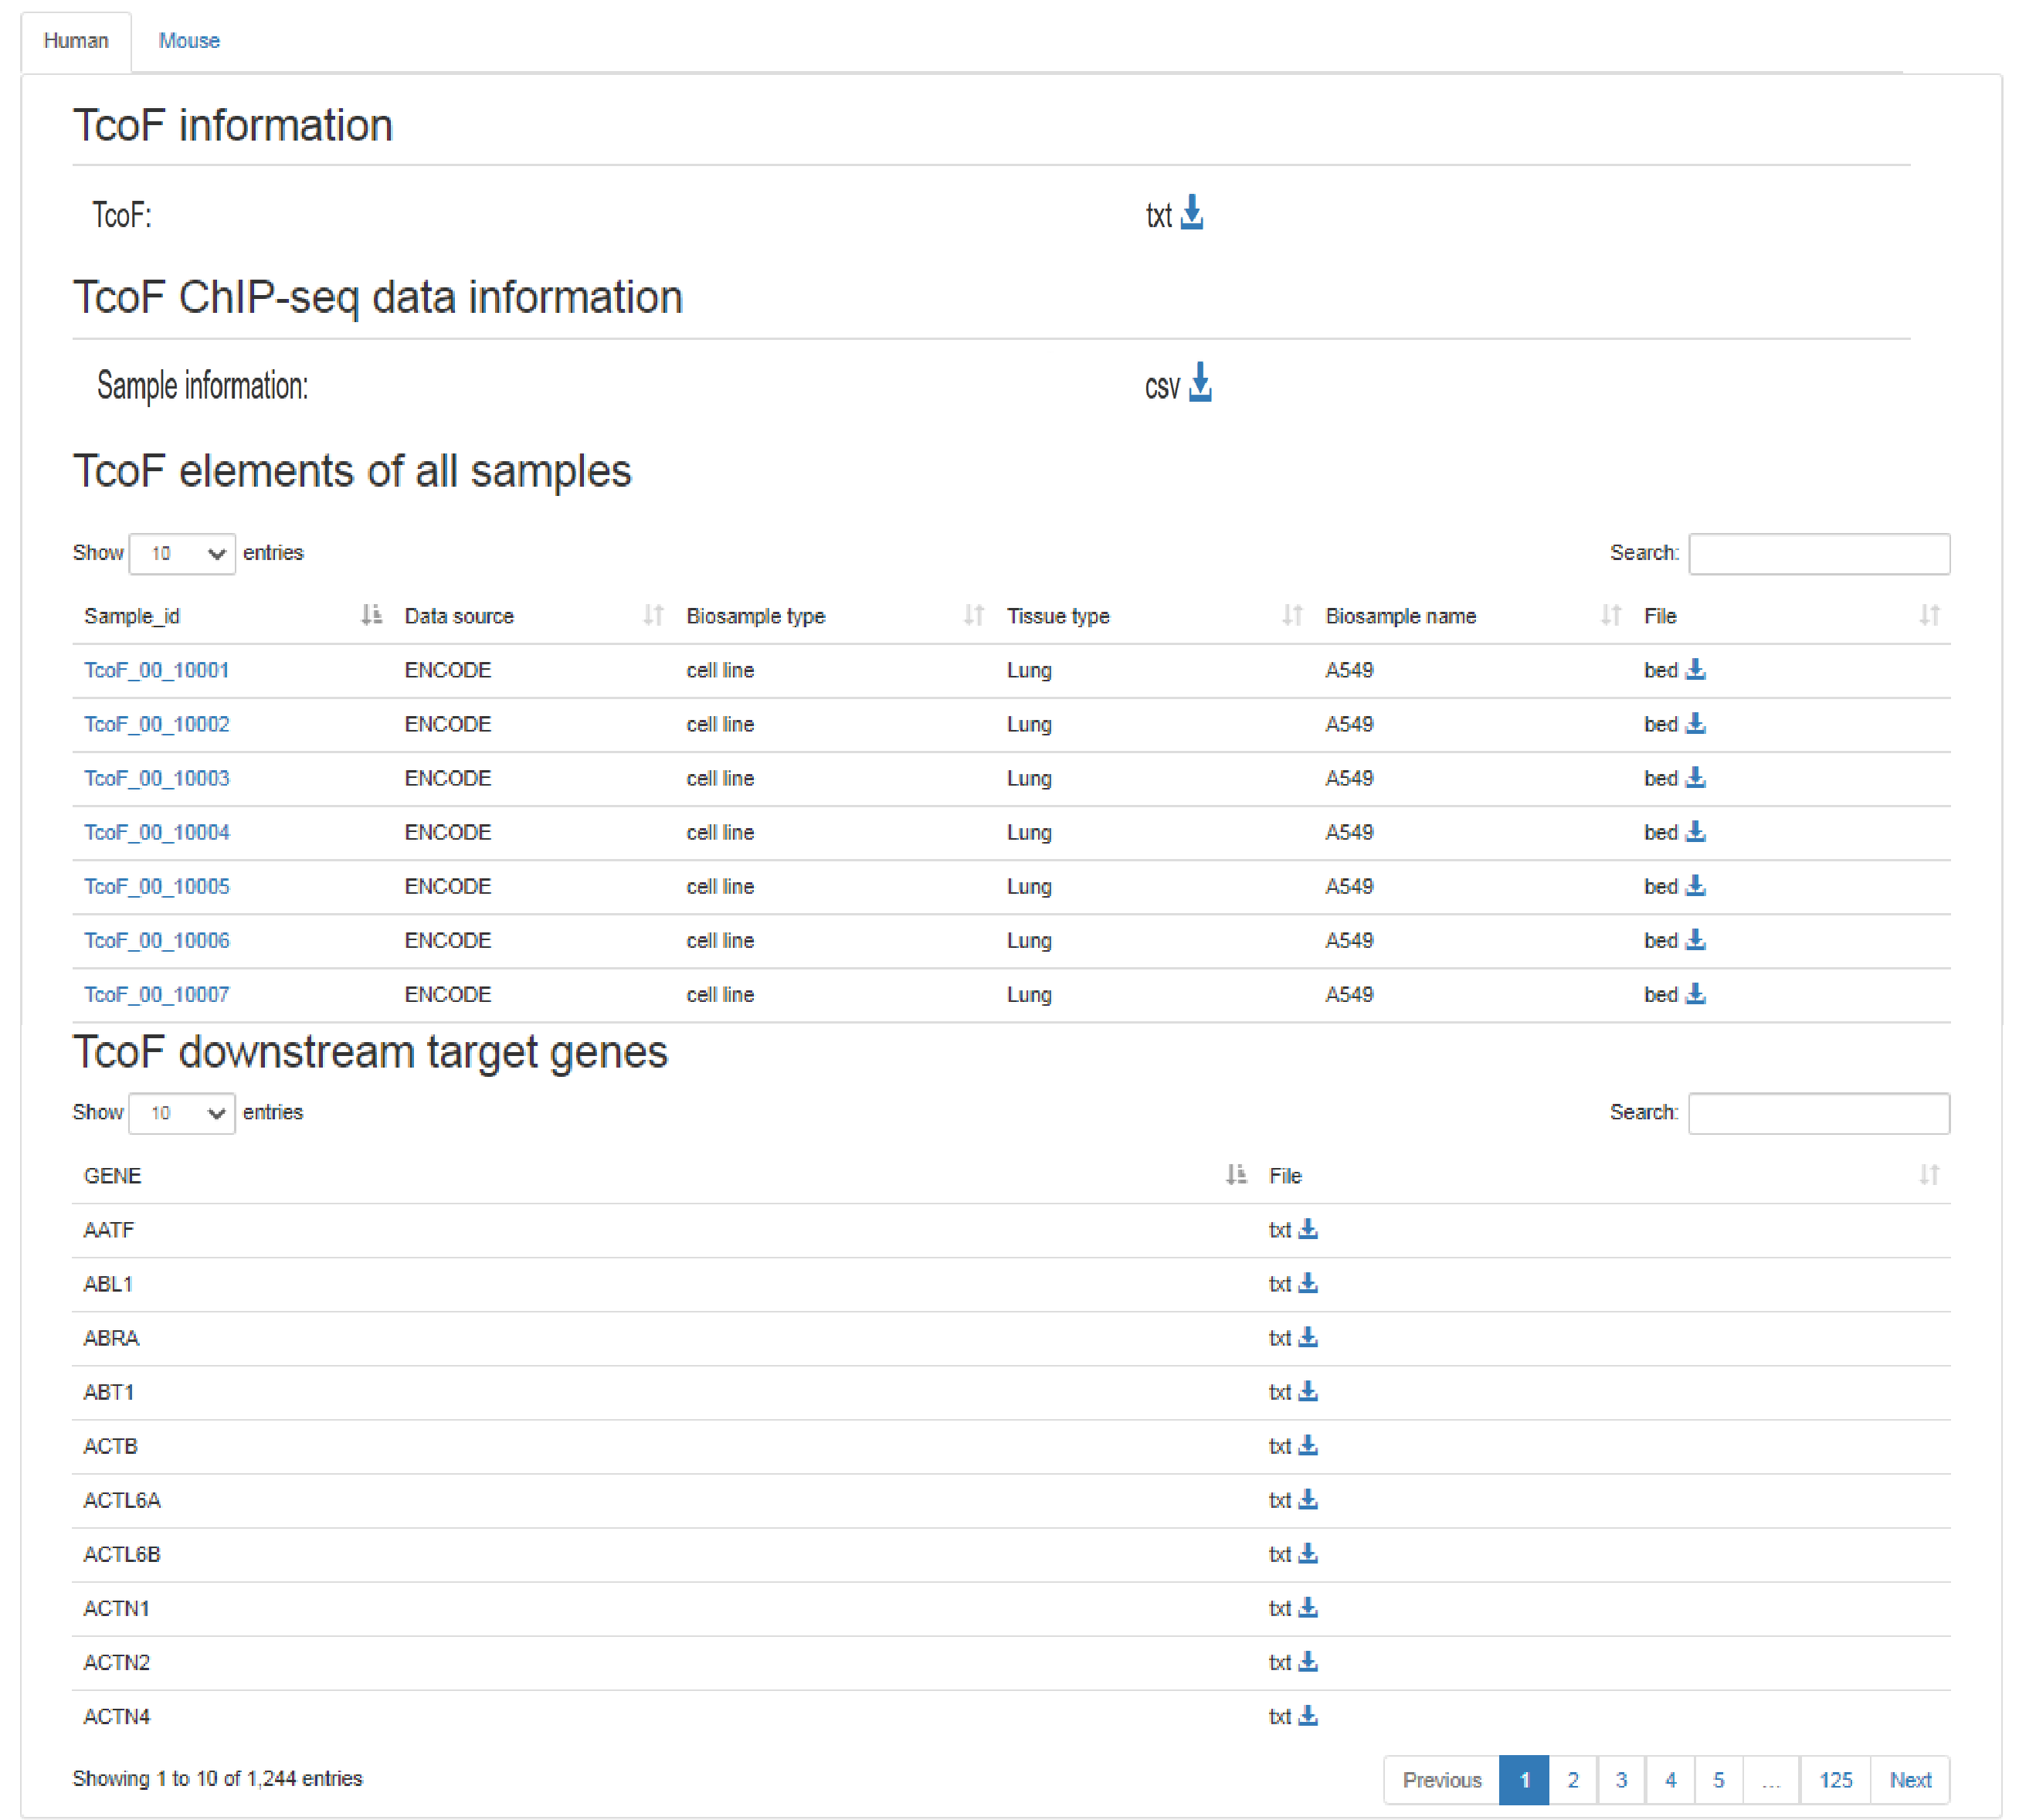
URL: http://tcof.liclab.net/TcoFbase/download.php
The ‘Download’ page exhibits ‘TcoF information’, ‘TcoF ChIP-seq data information’,’ TcoF elements of all samples’, ‘TcoF downstream target genes’. We support ".bed" or ".txt" formats for data download.
The current version of TcoFBase was developed using MySQL 5.7.17 (http://www.mysql.com) and runs on a Linux-based Apache Web server (http://www.apache.org). PHP 7.0 (http://www.php.net) was used for server-side scripting. The interactive interface was designed and built using Bootstrap v3.3.7 (https://v3.bootcss.com) and JQuery v2.1.1 (http://jquery. com). ECharts (https://www.echartsjs.com/) and Highcharts (https://www.highcharts.com.cn/) were used as a graphical visualization framework. We recommend to use a modern web browser that supports the HTML5 standard, such as Firefox, Google Chrome, Safari, Opera or IE 9.0+ for the best display.
The TcoFBase database is freely available to the research community using the web link (http://tcof.liclab.net/TcoFbase/index.html). Users are not required to register or login to access features in the database.